Why Own Bonds: Income and Ballast for Your Portfolio

A bond is a loan. When you own one, you’re the lender.
Bonds are not the growth engine of a portfolio. Their jobs are income, stability, and funding spending when stocks are down.
Over a holding period of several years, a bond fund’s return tends to land near its starting yield. For high-quality bonds, that makes starting yield the best guide to future returns. Extra yield from a riskier borrower is pay for taking more risk, not a promise of a higher return.
Bond interest is usually taxed as ordinary income, so what matters is what you keep after taxes. That’s why the type of bond and the account that holds it can matter as much as how much you own.
Short on time? Download the one-page summary (PDF).
Two Sides of the Same Loan
Think about the last time you took out a mortgage or a car loan. The rate you locked in shaped your costs for years. Someone on the other side of that loan was living with the same rate.
Borrowing solves a timing problem. A mortgage lets a family live in a home now instead of after decades of saving. A company builds a factory before it has the sales to pay for it. A city opens a school today and pays for it over the years students use it. Borrowing also lets people and businesses keep cash on hand for the unexpected instead of spending it all up front. In each case, borrowing pulls the future forward and keeps options open.
Lenders make that possible, and they’re paid to wait. For a bond investor, the trade runs the other way: money set aside today, with a known payback, for spending that’s coming later.
Borrowers who lock in low rates before rates rise come out ahead, and the lenders on the other side fall behind. When rates are high, lenders lock in meaningful income, and they benefit further if rates later fall.
Every dollar borrowed is a dollar someone else is owed. Bond investors are the lenders. That simple idea explains most of what bonds do, why their prices move, and why the yield you buy at matters so much.
This guide explains what bonds do, how they work, and how taxes shape which ones to own and where.
Borrowing pulls the future forward and keeps options open.
Meet Two Households
We’ll follow two composite, hypothetical households through this guide. Same asset class. Very different jobs.
Maya and Dev are 38 and 40 and live in San Francisco. Both work in tech. Salaries plus RSU vesting put their household income above $1 million. That means a 37% top federal rate, the 3.8% net investment income tax, and California’s 13.3% top rate. Together, about 54 cents of every dollar of taxable interest they earn goes to taxes.
They have about $1.2 million invested across 401(k)s, Roth IRAs, and a brokerage account. They also hold a large position in Dev’s company stock. They plan to buy a home in about three years.
Linda and Tom are 63 and 65 and live in Orange County. Tom retired this year. Linda retires next spring. They have $2.5 million saved, about $1.6 million in IRAs and 401(k)s and $900,000 in a brokerage account. They plan to spend about $120,000 a year and delay Social Security until 67 and 70. Until then, their portfolio carries the full load.
They are doing Roth conversions in these gap years sized to keep income just below the first IRMAA threshold, where Medicare premium surcharges begin. That also keeps them under the 3.8% net investment income tax and places them in the 22% federal bracket and the 9.3% California bracket. Together, nearly a third of their taxable interest goes to taxes.
The Jobs Bonds Do
When stocks are setting records and bonds barely move, it’s natural to wonder why you own them. That contrast is the portfolio working as designed. Every part of a portfolio has a job. Bonds have four.
- Income: Bonds pay a known stream of interest. When yields are healthy, a high-quality bond portfolio can produce meaningful cash flow on its own.
- Stability: A bad year for high-quality bonds is a decline of a few percent. Stocks can fall 30% or more. That difference helps people stay invested when stocks fall hard. That’s why bonds are often called ballast: they don’t stop the waves, but they keep the boat upright.
- Diversification: Over the past century, bonds rose in 21 of the 25 years that stocks fell. In recessions and financial panics, high-quality bonds, especially Treasuries, have tended to hold up or rise. The exception is an inflation shock like 2022, when both can fall together. More on that below.
- Rebalancing fuel: When stocks drop, bonds give you something to sell so you can buy stocks at lower prices.
They don’t stop the waves, but they keep the boat upright.
For Linda and Tom: the bridge
For retirees, bonds play one more role. They protect against sequence-of-returns risk.
The danger isn’t a steep market decline itself. It’s being forced to sell stocks during one to pay the bills. A deep decline early in retirement, combined with withdrawals, can permanently shrink a portfolio even after markets recover.
The fix is to set aside several years of spending in assets that won’t swing much. A simple structure:
Most major stock market declines have recovered within three to five years. The 2000s were a reminder that it can take longer, which is why seven years is a sensible outer edge. For a fuller walkthrough, see our guide to the three-bucket strategy.
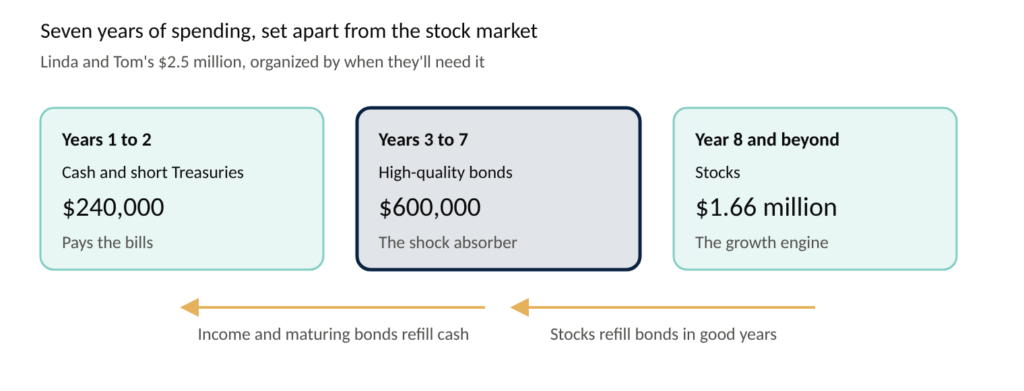
For Linda and Tom, seven years of spending is roughly $840,000, about a third of their savings. That isn’t a timid portfolio. It simply means the next seven years of groceries, travel, and property taxes aren’t tied to the stock market.
For Maya and Dev: the counterweight
Maya and Dev aren’t spending from their portfolio, so their bonds do different work.
The first job is their home down payment. Money needed in three years shouldn’t depend on the stock market. It belongs in short-term, high-quality bonds.
The second job is less obvious. Their careers and Dev’s company stock are already a large bet on stocks, and on tech in particular. When tech stocks fall, RSUs lose value, bonuses shrink, and layoffs become more likely, all at once. A modest bond allocation balances a risk that never appears on a brokerage statement.
Think Like the Bank
That’s what bonds do. Here’s how they work. Bonds can sound complicated. Borrowing doesn’t. Almost everyone has had a mortgage, a car loan, a student loan, or a credit card.
When you buy a bond, you become the lender. Everything you know about borrowing still applies. You’re just on the other side of the table.
| Factor | What you know as a borrower | What it means as a bond investor |
|---|---|---|
| Credit quality | Your credit score sets your rate | The borrower’s credit rating sets the yield you earn |
| Collateral | A mortgage costs less than a credit card because the house backs it | Safer or better-backed borrowers pay less; riskier ones pay more |
| Term | A 30-year mortgage usually carries a higher rate than a 15-year one | Lending for longer usually pays more |
| Rate type | Fixed versus adjustable rate | Bonds lock in a rate; cash and savings float |
| Early repayment | You refinance when rates drop | Borrowers repay early when rates fall, and you lose your good rate |
| Access on demand | A savings account is a loan to your bank you can call back any day | Cash is the shortest loan there is |
| Set term | A CD is a loan to your bank for a fixed period | A short-term bond, with an early-exit penalty instead of a price |
Why bond prices move
Imagine you made a loan at 4%. Today, new loans of the same kind pay 6%. If you wanted to sell your 4% loan, nobody would pay full price. You’d have to offer a discount. That discount is why bond prices fall when rates rise.
It works in reverse, too. If new loans pay only 2%, your 4% loan is worth more than you paid.
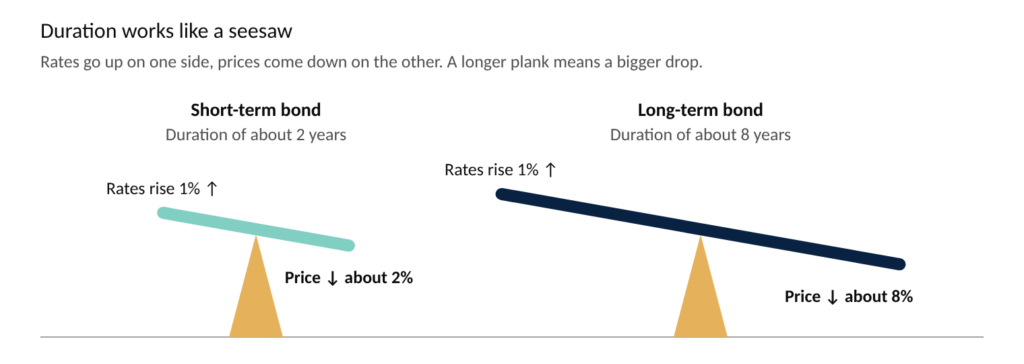
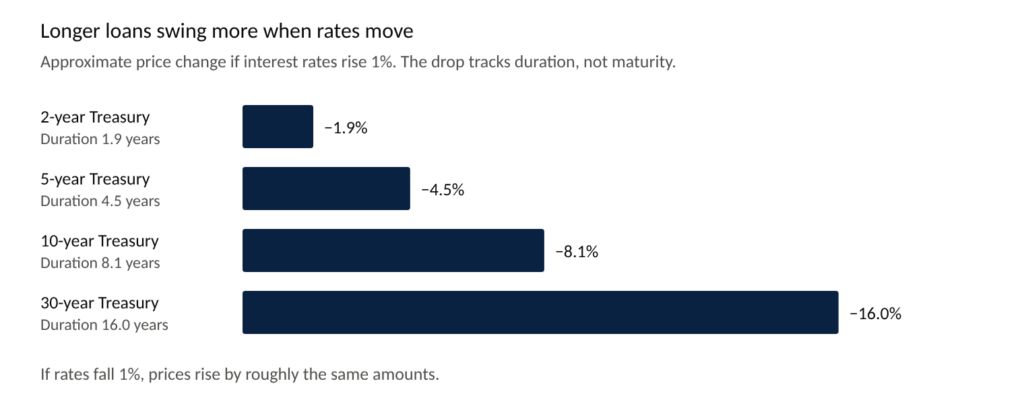
The length of the loan matters. A loan with 25 years left needs a much bigger discount than one with 2 years left, because the buyer is stuck with the old rate longer. And if you simply hold a bond until it’s repaid, the discount disappears. A bond that reaches maturity pays back its full face value.
Bond investors have a name for this sensitivity: duration. It’s measured in years, and it works as a simple rule of thumb. A bond with a duration of 5 will lose about 5% of its value if rates rise 1%, and gain about 5% if rates fall 1%. The longer the loan, the higher the duration, and the bigger the swing.
What sets the price of money
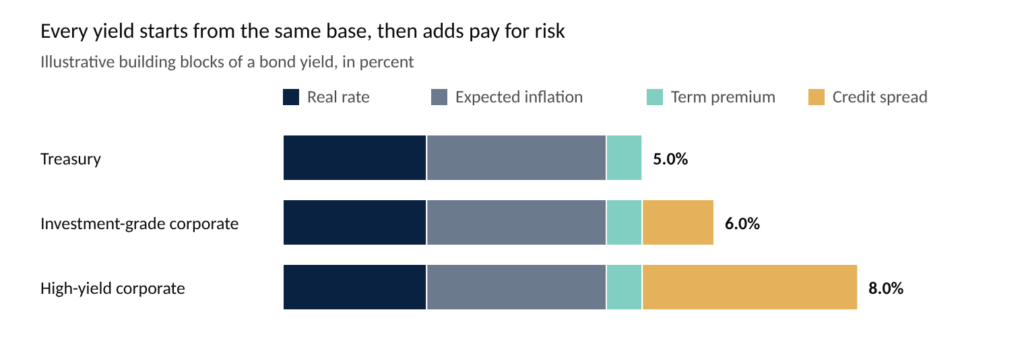
An interest rate is the price of money. Like any price, it reflects supply and demand, and it changes as conditions change. Any bond’s yield can be built from four blocks:
Yield ≈ Real rate + Expected inflation + Term premium + Credit spread
- Real rate: What lenders demand for giving up money today, after inflation. It tends to rise when the economy is strong and demand for borrowing is high.
- Expected inflation: Lenders want to be repaid in money that still buys something. When inflation expectations rise, yields rise with them.
- Term premium: Extra pay for locking money up longer and living with uncertainty. It grows when government borrowing is heavy, when large buyers step back, or when the future feels less predictable.
- Credit spread: Extra pay for lending to anyone other than the U.S. government. It widens when recession fears rise and narrows when confidence returns.
The Federal Reserve sets the shortest interest rate directly, steering it to balance inflation and employment. Longer yields are set by the market, based on where investors expect short rates to go plus the term premium. That’s why long-term rates can rise while the Fed is cutting, and fall while it’s hiking.
Your mortgage rate works the same way, which is why the same house can cost very different amounts to finance from one year to the next.
The Main Types of Bonds
Each type of bond is a loan to a different kind of borrower. What differs is who you’re lending to, and what that means for risk and taxes.
The most common benchmark for U.S. bonds is the Bloomberg U.S. Aggregate Bond Index, often called “the Agg.” It holds investment-grade taxable bonds, mostly Treasuries, mortgage-backed securities, and corporates. It leaves out municipal bonds, TIPS, and high yield, so it may not reflect the bonds many high earners actually own.
Because the index weights each borrower by how much it has borrowed, years of federal deficit spending have pushed U.S. Treasuries from under a quarter of it in the 2000s to nearly half today. Index weights reflect where borrowing has happened, not necessarily where the best value is. That’s one reason bonds are an area where active managers have a better record of beating their benchmark. Some add value by adjusting maturity and credit quality based on what market prices signal, and by trading carefully. Others beat the index mainly by holding riskier bonds, an edge that can reverse when the economy weakens. Knowing which approach you own matters.
What Drives Bond Risk and Return
Every bond’s return comes from four pieces:
- Income: The interest you collect, roughly the yield you start with.
- Price changes: Prices fall when rates rise or when investors demand more to lend to companies, and rise when the reverse happens.
- Rolldown: As a bond ages, it moves toward shorter maturities. When longer bonds pay more than shorter ones, its price drifts up along the way.
- Subtractions: Defaults from riskier borrowers, and fund costs every year.
A few key forces shape how those pieces play out.
The cushion
Yield also acts as a cushion. Rising rates can push a bond’s price down, but the interest keeps coming as long as the borrower pays. That income offsets some or all of the decline. A fund yielding 5.5% with a duration of 5.8 earns enough in a year to roughly offset a one-point rise in rates.
The higher the starting yield, the thicker the cushion. When yields are very low, the cushion is thin, and even modest rate increases can produce losses. When yields are higher, a year of income can absorb a meaningful rise in rates before you lose money.
Why starting yield wins out over time
When rates change, two effects pull against each other. If rates rise, prices fall at first, but every interest payment gets reinvested at the new, higher yield. If rates fall, prices jump, but reinvestment happens at lower yields. Over a holding period near the fund’s duration, the two roughly cancel.
The chart below follows a fund starting at a 5.5% yield and a 5.8 duration through three simple scenarios: rates unchanged, rates up 1% immediately, and rates down 1% immediately.
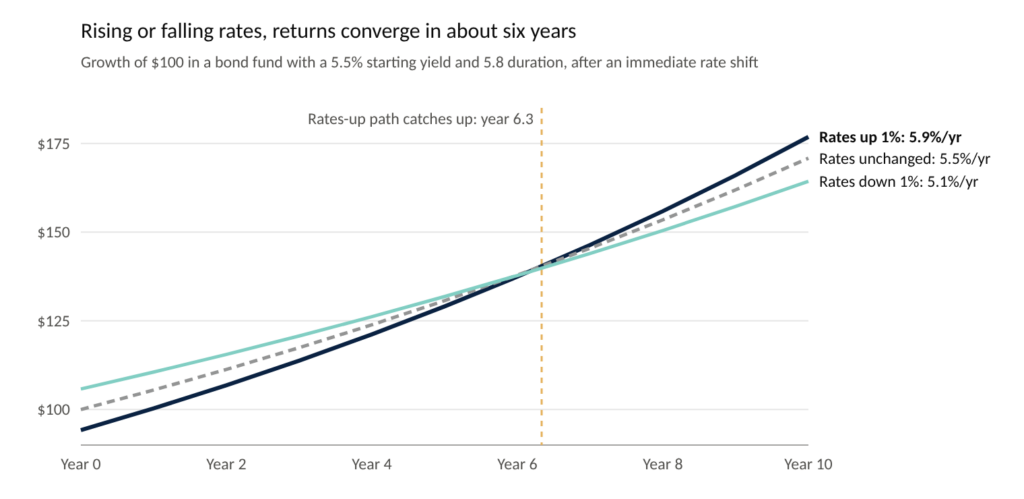
When rates rise, the first year returns about 0.3%, yet the fund overtakes the unchanged path after about six years. When rates fall, the first year returns about 10.6%, but the lead fades over the same stretch. Over ten years, all three paths average between about 5.1% and 5.9% a year.
The practical lesson: if your time horizon roughly matches your bond fund’s duration, starting yield is a reasonable estimate of what you’ll earn. A single disappointing year doesn’t mean a bad decision.
A single disappointing year doesn’t mean a bad decision.
Turning the Dials
| Dial | Turning it up earns you | The trade-off |
|---|---|---|
| How long you lend (duration) | Higher yield | Bigger price swings when rates rise or fall |
| Who you lend to (credit) | Higher yield | Losses when the economy weakens |
| Where on the curve you lend (rolldown) | A boost as bonds age | Less benefit if the curve flattens |
| Inflation protection (TIPS) | Protection if inflation surprises | Slightly less income if inflation stays tame |
| Early repayment (callable bonds) | Higher yield | Your money paid back early, but just when rates are lower |
| Taxes (munis and account location) | More income kept | Only pays off in the right bracket and account |
Ladders, bullets, and barbells
How maturities are arranged matters too.
- A ladder holds bonds maturing year by year. Each maturing bond funds a year of spending or gets reinvested at the far end. Ladders match known spending dates and naturally capture rolldown as each bond ages.
- A bullet concentrates maturities around a single date. It suits one large, known expense.
- A barbell pairs very short bonds with longer ones, skipping the middle. It keeps flexibility at one end and locks in yield at the other.
I am not arguing against any of those choices. I am arguing that they should be chosen rather than absorbed. A family that deliberately picks the ones that matter most to them and says no to the rest is usually in a stronger position, financially and otherwise, than one that says yes to everything because saying no felt like a failure of love.
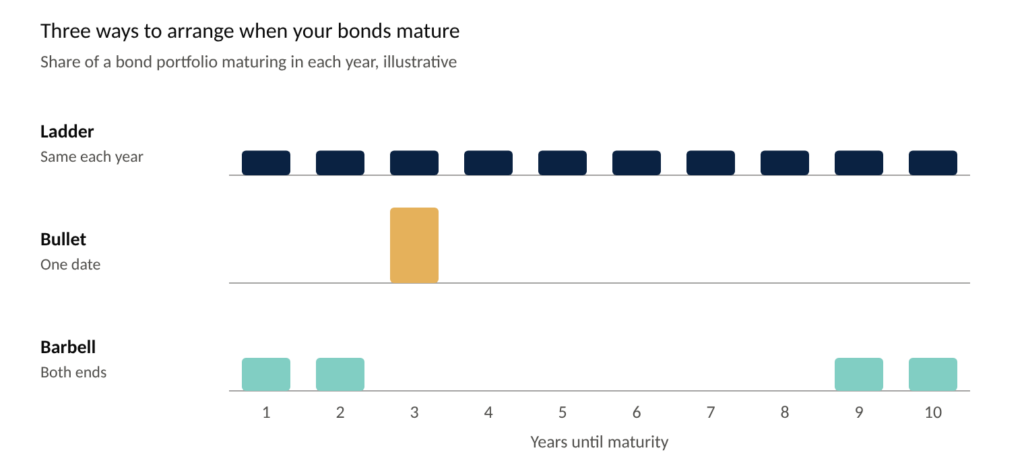
For Linda and Tom, the bridge fits a ladder of Treasuries maturing in years 3 through 7, held in their brokerage account. Each year, the shortest bond matures into their cash bucket.
For Maya and Dev, the down payment fits a bullet maturing around their purchase date, in Treasuries or California munis in their brokerage account. Their longer-term diversifying bonds can lean toward high-quality, intermediate maturities in their 401(k)s.
How Taxes Change the Math
Two bonds with the same yield can deliver very different results after taxes. For high earners, especially in high-tax states, this is often the most important part of choosing bonds.
- Treasuries: federal tax only. Exempt from state tax.
- Municipal bonds: generally exempt from federal tax. Bonds issued in your home state are usually exempt from state tax too; out-of-state munis usually aren’t.
- Corporate bonds, CDs, and bank interest: fully taxable at both levels.
- Net investment income tax: the 3.8% surtax applies to taxable interest above certain income levels, but not to municipal bond interest.
- Adjusted gross income (AGI): taxable interest raises your AGI, which can reduce deductions and credits and push you past key income thresholds. Municipal bond interest stays out of AGI, though it still counts in a few retirement calculations.
Tax-equivalent yield
To compare a muni with a taxable bond, convert the muni’s yield into its taxable equivalent:
Tax-equivalent yield = Muni yield ÷ (1 − your tax rate)
Here’s how it plays out for our two households, using approximate yields as of early October 2026: 10-year California muni 4.15%, 10-year Treasury 5.28%, investment-grade corporate 6.07%, and CD 4.10%.
Maya and Dev pay 37% federal, 3.8% net investment income tax, and 13.3% California, about 54% combined. Linda and Tom pay 22% federal and 9.3% California, about 31% combined.
| After-tax yield | Maya and Dev (top bracket) | Linda and Tom (moderate bracket) |
|---|---|---|
| California muni | 4.15% | 4.15% |
| Treasury | 3.13% | 4.12% |
| Corporate | 2.79% | 4.17% |
| CD | 1.88% | 2.82% |
For Maya and Dev, the 4.15% muni is equivalent to a fully taxable bond yielding about 9.0%. Munis win decisively.
For Linda and Tom, a taxable bond would need to yield only about 6.0% before taxes to match the same muni. After taxes, munis, Treasuries, and corporates all land between about 4.1% and 4.2%, so the choice is roughly even.
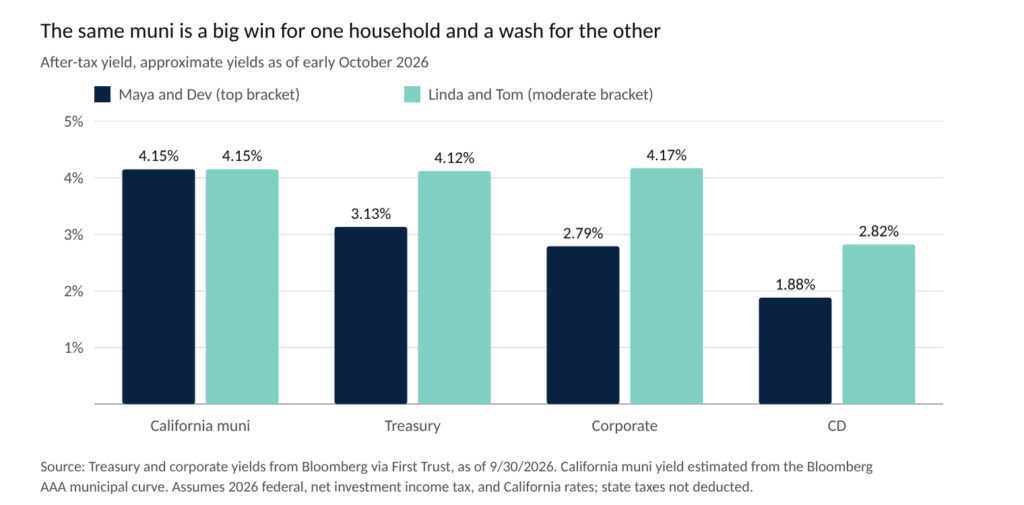
The point isn’t that munis are better. They’re better for some people, in some accounts. The table assumes state taxes aren’t deductible, which holds for most high earners under the SALT cap.
Tax details worth knowing
Some munis aren’t fully tax-free. Certain munis that fund projects like airports or stadiums, called private activity bonds, can count toward the alternative minimum tax. That’s a parallel tax calculation some higher earners must also run, paying whichever result is higher. It matters more now that it reaches more households, especially those exercising incentive stock options.
Muni interest still counts in retirement. Tax-free interest is included when calculating tax on Social Security benefits and Medicare premium surcharges (IRMAA).
Bond losses can be harvested. When rates rise, bond funds can fall below what you paid. Selling them and buying a similar fund can realize a tax loss while keeping the same exposure.
Where Bonds Belong, and How Much
Asset location means deciding which account holds each investment. Done well, it can add after-tax return without adding risk.
- Taxable bonds, such as corporates, often fit best in traditional IRAs and 401(k)s, where interest isn’t taxed each year.
- Municipal bonds belong in taxable brokerage accounts for high earners. Holding them in an IRA wastes their tax advantage.
- Treasuries work in either, with extra value in taxable accounts for residents of high-tax states.
- Stocks with the highest growth potential often fit best in Roth accounts, where growth is never taxed.
For Maya and Dev. Their down payment fund sits in short-term Treasuries in their brokerage account. Bonds held for diversification go into their 401(k)s. Any additional bonds in their brokerage account would be California munis, which suit their bracket.
For Linda and Tom. Their spending bridge is a deliberate exception to the usual rule. It lives in their brokerage account, mostly in Treasuries, whose interest California doesn’t tax. Spending from that account keeps their taxable income low, which leaves room for Roth conversions. Any corporate bonds go in their IRAs, where interest isn’t taxed each year.
How much?
There’s no universal stock and bond mix. The right amount depends on four questions:
- How many years of spending do you need to protect?
- What large purchases are coming in the next few years?
- How much income arrives from elsewhere, such as a paycheck, pension, or Social Security?
- How large a decline could you live through without changing course?
For Linda and Tom, the spending bridge sets a floor of roughly a third in bonds and cash. For Maya and Dev, the down payment fund plus a modest diversifying allocation may be all they need.
Bonds Versus Cash and CDs
Cash and CDs often feel safe because their value doesn’t move. Over time, that safety has a cost.
Cash still has a role. It’s the right home for an emergency fund and the next year or two of known spending. For how much to keep, see our guide to building a cash buffer. Beyond that, high-quality bonds have historically been the better long-term home.
What About Higher-Yield Alternatives?
Cash sits on the safe side of bonds. Higher-yield investments sit on the other. When bonds disappoint, they start to look appealing. Preferred stock, dividend stocks, master limited partnerships (MLPs), and private credit all offer attractive yields. None of them does a bond’s job.
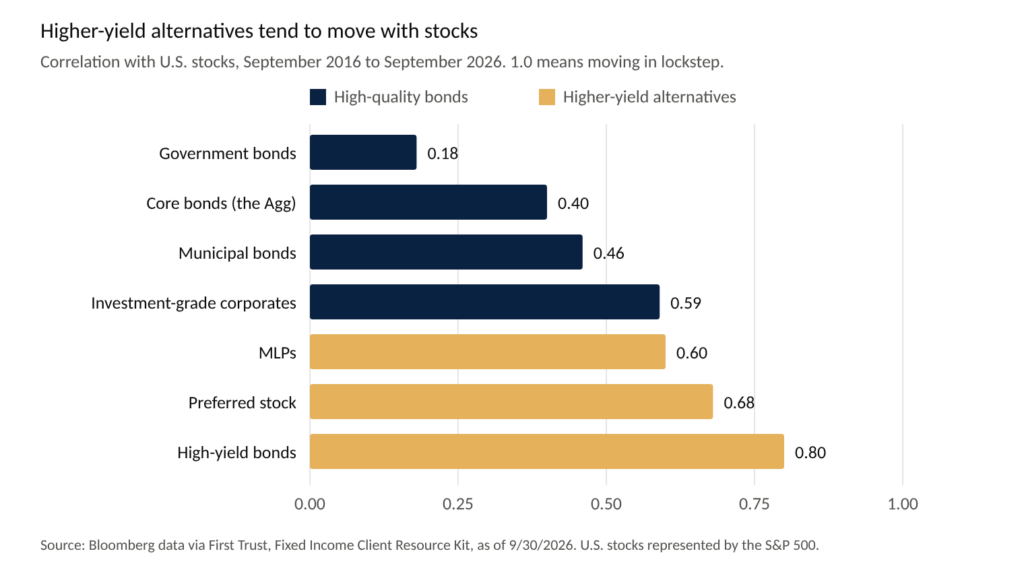
Higher yield usually means you’ve traded away the very thing bonds are for.
Where Bonds Stand Today
As of October 2026.
How we got here: When rates rose quickly from near-zero levels in 2022, bonds had almost no income to cushion the price decline. Those losses are what reset yields to today’s levels.
- Yields have returned to normal: The 10-year Treasury touched 5.30% in September, its highest level since 2002. That’s well above the average of the past 15 years, but slightly below its average of about 5.7% since 1962. After inflation, yields are higher than usual: the broad bond market’s real yield is about 3.1%, against a long-term average near 2.5%.
- The curve slopes upward: Longer bonds pay more than cash again, and rolldown works in investors’ favor, though the difference between 10-year and 2-year yields is still smaller than its historical average.
- Credit pays relatively less than usual: The extra yield for lending to companies is below its 10-year average. That partly reflects good news: company finances are generally strong, and the economy has kept growing. Total yields on corporate bonds are still attractive because Treasury yields are high. The trade-off is less cushion if conditions change.
- What’s driving it: Unlike 2022, this rise has come mostly from higher real yields rather than inflation. Strong growth, heavy AI-related investment, and large government borrowing are all competing for capital, and yields have risen abroad too. Higher oil prices have added inflation pressure, and the Fed responded in September with its first rate hike in three years.
- Looking ahead: The broad bond market yields about 5.6%. Historically, a starting yield like that has pointed to returns in a similar range over the next five years. Over the next year, a 1% drop in rates would mean a return of roughly 11%, no change about 5.6%, and a 1% rise roughly flat. That is today’s cushion at work.
In plain terms: high-quality bonds offer more than they have in years, and riskier bonds offer less extra reward than usual.
Data as of September 30, 2026. Sources: J.P. Morgan Asset Management, Guide to the Markets; Bloomberg data via First Trust; Kitces.com/Clearnomics; Robert Shiller and U.S. Treasury yield history.
Four Questions to Ask About Your Bonds
- What job are your bonds doing: income, stability, diversification, or funding a specific goal?
- How many years of spending or upcoming goals do they cover?
- Is each type of bond held in the account that suits its tax treatment?
- Does your tax bracket favor municipal bonds, Treasuries, or neither?
Bonds don’t need to be exciting. They need to do the job your plan assigned them.
Disclaimer: This article is for general informational purposes only and is not intended to provide, and should not be relied on for, legal, tax, or accounting advice. Please consult a qualified estate planning attorney or tax advisor regarding your individual circumstances.
Derek Pantele, CFP®, CFA is the founder of Affinity Financial, a wealth advisory firm based in Orange, CA. He works with professionals and families navigating major financial decisions, including equity compensation, liquidity events, and long-term wealth planning.
Are you overpaying taxes?
Take the 2-minute quiz to find out.
EXPLORE TOPICS


Start Your Next Chapter and Pursue Exciting Financial Goals
Click below and schedule a complimentary consultation
Similar Posts



No results found.